Setting up Prometheus, Grafana and Spring Boot
Written on by rd
Table of contents
Skip navigation- Setting up Prometheus and Grafana using Docker-Compose
- Reading Spring Boot Metrics in Prometheus und Grafana
- Reading Spring Boot Logs in Grafana
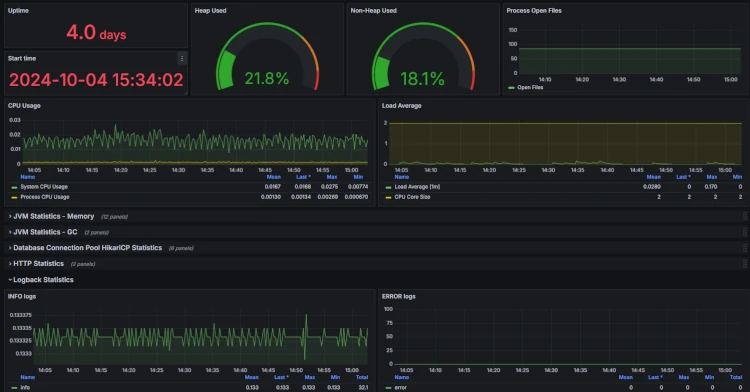
Server and applications form the core part of every organization in today's digital world. To make sure that everything is running without a hitch, server monitoring is essential. It helps us to detect and resolve problems early on, before they lead to performance issues or even complete failure. By keeping an eye on important metrics such as CPU- and memory usage, we can optimize our systems and improve user experience.
This is where Prometheus and Grafana come into play. Prometheus is a cool open source tool that ensures that we have an overview of all important data. it collects and stores metrics in realtime and turns the montoring of dynamic environments into child's play. This is complemented by Grafana's ingenious visualisation. With these tools, we can create dashboards that enable us to present to present our data clearly and help us to quickly recognize trends and patterns.
This combination of Prometheus and Grafana presents the perfect solution to keep our server under control and make data-based decisions. This means that we are alway up to date and can approach problems proactively.
Setting up Prometheus and Grafana using Docker-Compose
The fastest way to get Prometheus and Grafana up and running is via Docker. It's a huge timesaver regarding configuration and security, since Docker offers a solid base. The provided Docker-images are well preconfigured, making the easy getting in.
If Docker-Compose is not yet installed, feel free to check out the official documentation.
Docker Container for Prometheus and Grafana
In order to get started, create a new docker-compose.yml file on the server where Docker and Docker-Compose have been installed:
version: '3.7'

services:
  prometheus:
    image: prom/prometheus
    container_name: prometheus
    volumes:
      - ./prometheus.yml:/etc/prometheus/prometheus.yml
    ports:
      - "9090:9090"

  grafana:
    image: grafana/grafana
    container_name: grafana
    ports:
      - "3000:3000"
    environment:
      - GF_SECURITY_ADMIN_PASSWORD=admin
WATCH OUT: The default password "admin" should be changed at all costs if the server is publicly accessible, as this unsecure password might leave the door open for script kiddies and other undesirables.
Prometheus configuration-file
Another file prometheus.yml needs to be created within the folder containing the docker-compose.yml. Add the following code:
global:
  scrape_interval: 15s

scrape_configs:
  - job_name: "prometheus"
    static_configs:
      - targets: ["localhost:9090"]
We've now defined a scrape job that accesses the service localhost:9090, the Prometheus server itself. This configuration will load various expressions into Prometheus that you can use to read metric data related to the Prometheus server.
Accessing Prometheus and Grafana
After setting up the configuration, the Docker-container needs to be started using the following command:
docker-compose up -dIf no Firewall or anything similar is standing in the way, Prometheus and Grafana should now be accessible.
Prometheus can be accessed using the following link:
<server-ip>:9090
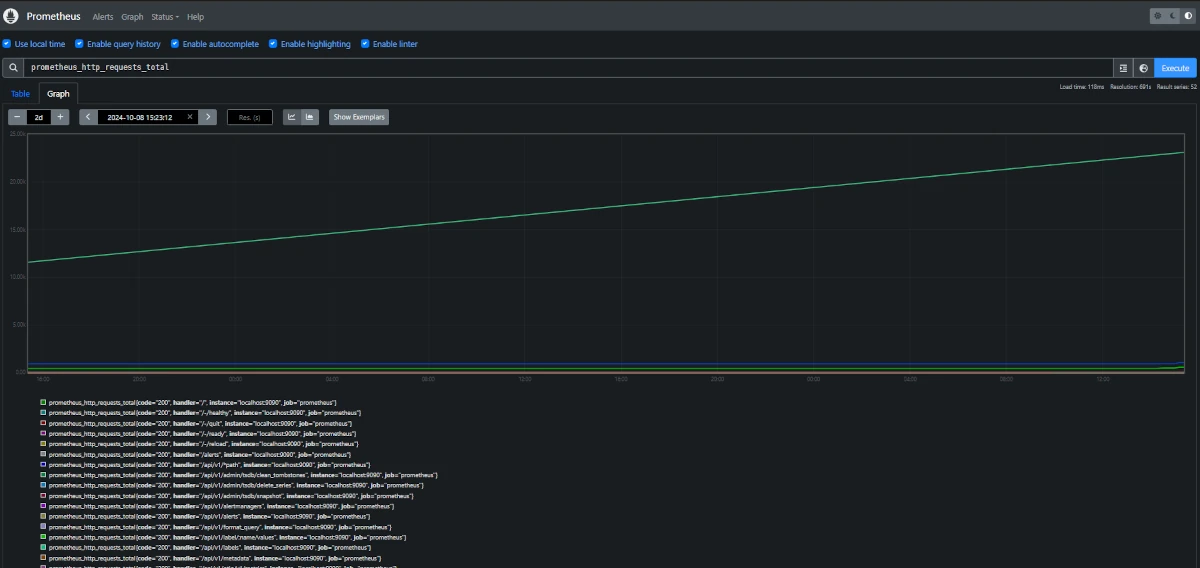
As we defined a Scraper in the configuration file that reads the metrics out of the Prometheus-ontainer, you may use the following link to show the number of HTTP-requests:<server-ip>:9090/graph?g0.expr=prometheus_http_requests_total&g0.tab=0&g0.display_mode=lines&g0.show_exemplars=0&g0.range_input=1h
Grafana can be accessed with the following link:<server-ip>:3000
The required password is the one defined in the docker-compose.yml-file.
As to be expected, Grafana ist quite empty. Before defining your own dashboard, Prometheus needs to be integrated using the following link:<server-ip>:3000/connections/datasources/new
Select Promotheus and enter the following IP:<server-ip>:9090
Save afterwards.
Displaying Prometheus metrics in Grafana
In Grafana, metric data is defined in dashboards and displayed visually depending on the configuration. To create a dashboard, open the following link:<server-ip>:3000/dashboards
Create a new dashboard by clicking on "New" in the top right corner, then selected Add visualization and as previously defined, selected Prometheus as data source.
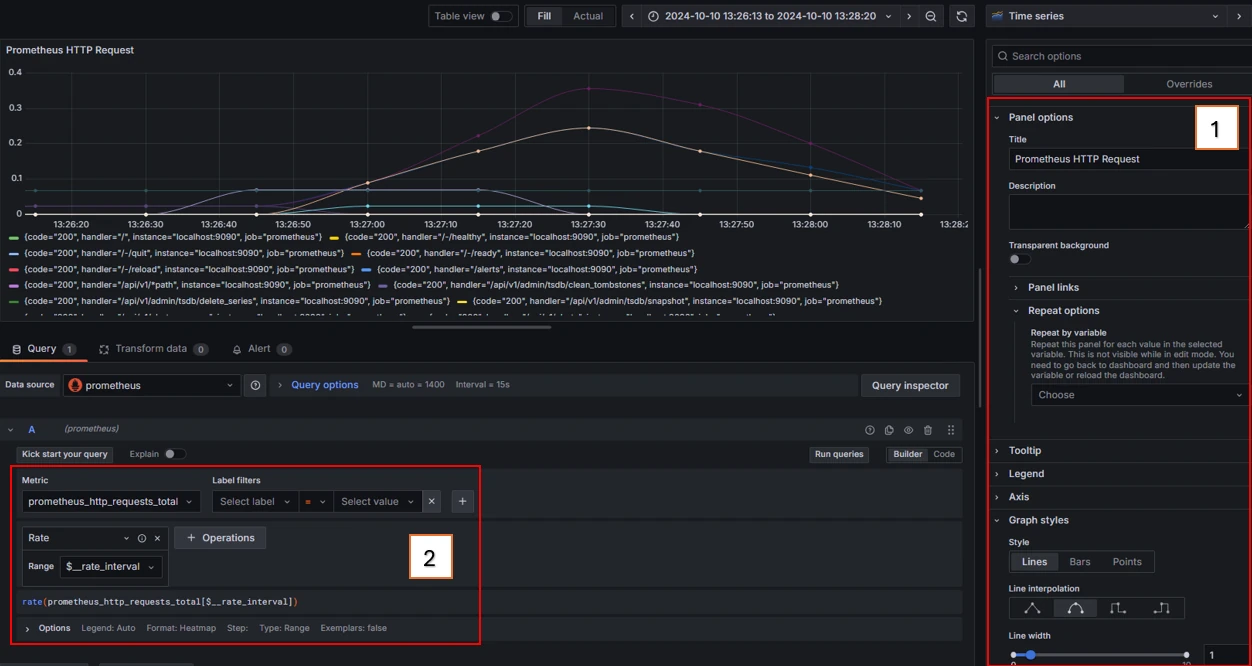
As first step, you can easily configure the panel. A panel contains one or multiple sets of metric data pulled from the data source. You can change all the relevant display settings, such as the title, background, graph-styles and many more.
The second step is to set up how the metrics should be displayed. Selected the respective metric to filter it, p.Ex. by certain codes available within the metric. You can also perform various operations, such as calculation the average values of certain values and much more.
You can find more detailled informations in the official introduction by Grafana:
https://grafana.com/docs/grafana/latest/panels-visualizations/query-transform-data/#add-a-query
...and here we are! You should now have a working environment with Prometheus and Grafana, ready to be experimented with. Prometheus and Grafana form a strong team when it comes to monitoring and visualisation. Both tools are flexible and offer a lot of possibilities to keep an eye on your systems and application.
Prometheus is your goto-tool when it comes to collecting and storing metric data in real time. It collects the data from your servers and applications, stores them and offeres a strong query language to analyse the stored data. Prometheus shows it's strength especially when it comes to monitoring microservices and dynamic environments.
Grafana complements Prometheus perfectly when it comes to the visualisation of the collected metric data. You can create interactive Dashboard that show your systems' behaviour at a glance. With Grafana, you can not only visualise Prometheus data, but also customise it to suit your needs.
Together, Prometheus and Grafana offer you a powerful monitoring system that allows you to keep a constant eye on both the performance of your infrastructure and the stability of your applications.
Reading Spring Boot Metrics in Prometheus und Grafana
Let's approach the monitoring with applications in mind.
Imagine having a Spring Boot application with loads of traffic and a hefty chunk of log entries stored in different areas. In this section, we'll set the whole thing up - using the Prometheus-dependency Promtail to send the log entries to Loki. Loki acts as an interface for Grafana in order to display the logs visually.
Installing the Spring Boot Prometheus dependency
As build-tool, we'll use Maven, however Gradle works too - the approach is the same
Maven:
We'll add the following dependency the pom.xml-file:
<dependency>
    <groupId>io.micrometer</groupId>
    <artifactId>micrometer-registry-prometheus</artifactId>
</dependency>
Gradle:
As for gradle, the following code needs to be added to the build.gradle:
implementation 'io.micrometer:micrometer-registry-prometheus'
The project needs to be rebuilt in order to apply the changes.
Spring Boot Prometheus configuration
In order to be able to read the metrics, either the application.properties or application.yml need to be updated as follows:
management.endpoints.web.exposure.include=prometheus
management.endpoint.prometheus.enabled=true
This change makes the Prometheus-metrics accessible via the respective endpoint.
Watch out: If Spring Boot Security is active, the endpoint needs to be allowed accordingly in order to access the metrics.
Configuring Spring Boot Metrics in Prometheus
In the following step, we'll update the scraper in the Prometheus configuration.
Let's add the following content to the prometheus.yml:
global:
  scrape_interval: 15s

scrape_configs:
  - job_name: 'prometheus'
    static_configs:
      - targets: ['localhost:9090']

  - job_name: 'spring-boot'
    static_configs:
      - metrics_path: "/actuator/prometheus"
      - targets: ['<springboot-server-ip>:8080']
Restart the container after applying these changes.
All done? There should be new expressions available in Prometheus or Grafana, such as jvm_info for example.
Spring Boot Metrics Grafana Dashboard example
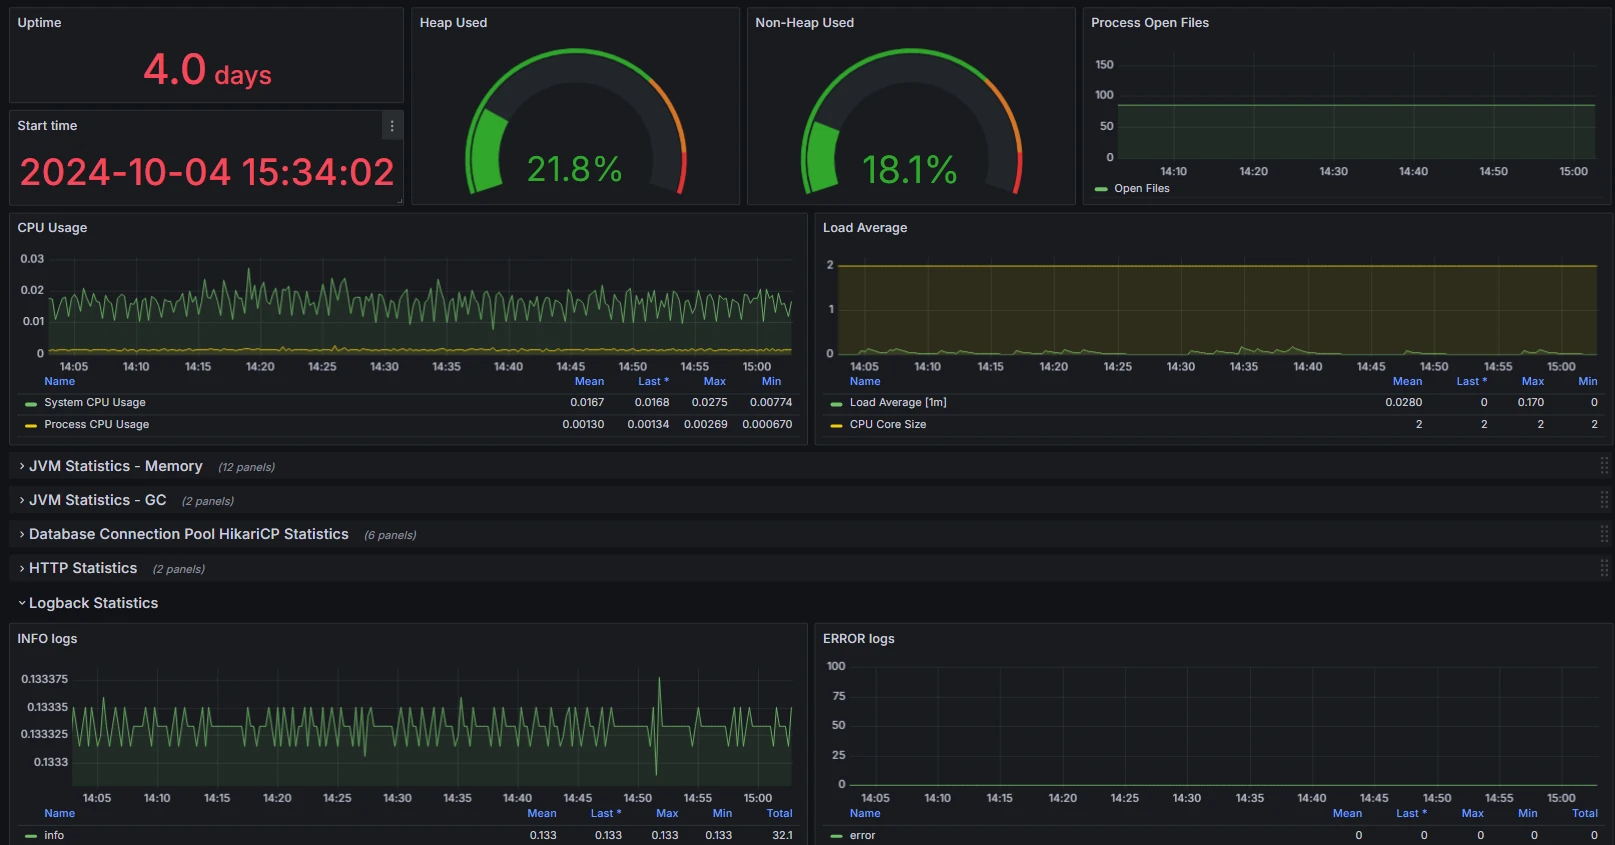
The ID or JSON-file for the Grafana import can be found on the following link:
https://grafana.com/grafana/dashboards/19004-spring-boot-statistics/
Reading Spring Boot Logs in Grafana
Reading Spring Boot logs within Grafana is sensible, as it allows you to monitor the performance and behaviour of your application in real time. The centralized visualisation of logs is a great tool to identify and analyze problems faster, which leads to more efficient debugging- and optimization processes. Grafana offers the possibility to search through logs interactively and correlate different metrics, thus greatly simplifying the error diagnosis. Not only does this give you an overview of the logs, but it also allows you to make informed decision regarding the improvement of your application.
In this process, a Docker installation is required in order to install the docker-image Promtail, which has Spring Boot running. Promtail is used to send Logs to Loki, which can also be installed via Docker-image, and is read by Grafana as it alreads offers a Loki datasource to display logs visually. This has no longer anything to do with Prometheus.
Installing Docker-Compose on the Spring Boot Server using Promtail
Create a docker-compose.yaml file on the Spring Boot server with the following content:
version: '3.8'
services:
  promtail:
    image: grafana/promtail:latest
    container_name: promtail
    volumes:
      - ../tomcat/logs:/var/log
      - ./promtail-config.yml:/etc/promtail/promtail-config.yml
    command: -config.file=/etc/promtail/promtail-config.yml
    restart: always
Watch out: The path ../tomcat/logs is merely an example. It's important to adjust the path of your logs, as it might be different on your server.
Configuring Promtail
Create a new file named promtail-config.yml and use the following template as content:
server:
  http_listen_port: 9080
  grpc_listen_port: 0

positions:
  filename: /tmp/positions.yaml

clients:
  - url:<grafana-server-ip>/loki/api/v1/push

scrape_configs:
  - job_name: "tomcat-logs"
    static_configs:
      - targets:
          - localhost
        labels:
          job: "tomcat"
          __path__: /var/log/*.log
Make sure that the url-entry points to your Grafana-server.
Go ahead and start the container afterwards.
Installation and configuration of Loki
Loki can be installed at the same location as Grafana by updaten the docker-compose.yml on your server as follows:
version: '3.7'

services:
  prometheus:
    image: prom/prometheus
    container_name: prometheus
    volumes:
      - ./prometheus.yml:/etc/prometheus/prometheus.yml
    ports:
      - "9090:9090"

  grafana:
    image: grafana/grafana
    container_name: grafana
    ports:
      - "3000:3000"
    environment:
      - GF_SECURITY_ADMIN_PASSWORD=admin

  # loki hinzufügen
  loki:
    image: grafana/loki:2.9.10
    container_name: loki
    command: -config.file=/etc/loki/local-config.yaml
    restart: always
    ports:
      - "3100:3100"
Start the Loki-container after applying these changes.
Including Loki in Grafana
In order to include Loki into Grafana, head back here:
<server-ip>:3000/connections/datasources/new
and select Loki as data source.und wählst als Data-Source diesmal Loki aus. Enter the following URL:
<server-ip>:3100
This allows you to create a new Dashboard and use Loki as data source.
Spring Boot INFO Logs Grafana example dashboard
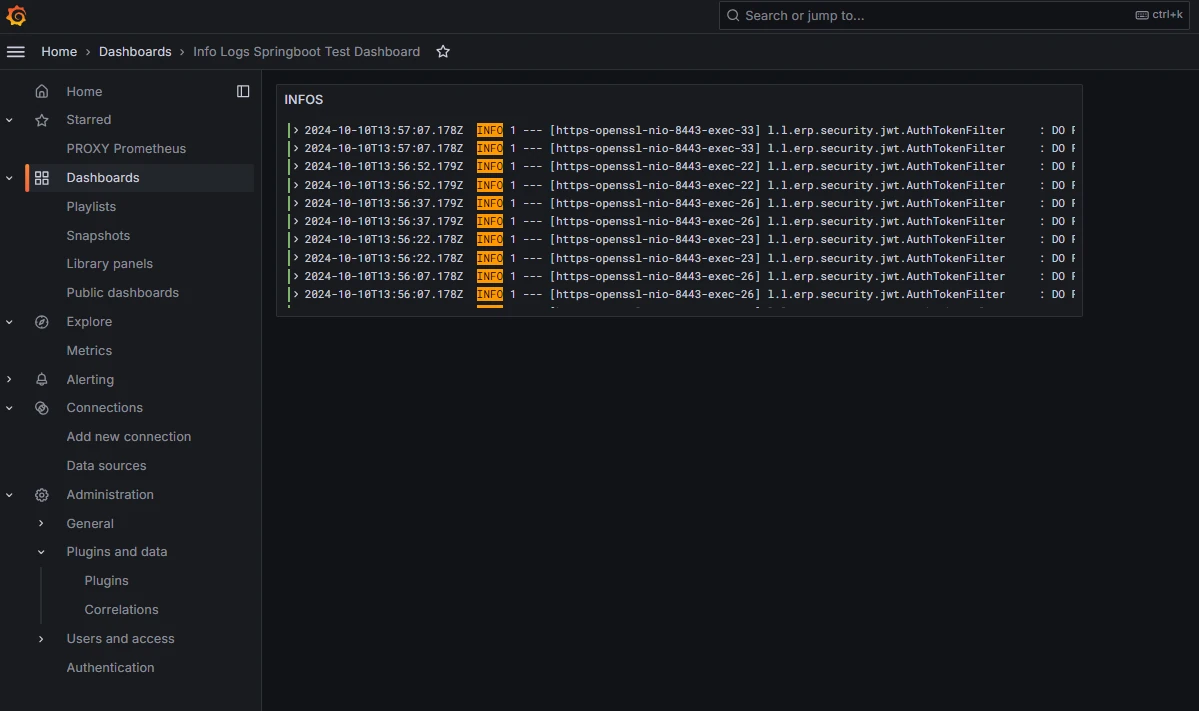
As example, you can import this dashboard as JSON file. It should display the INFO logs just like in the picture. We could of course clear the filter and apply individual filters:
{
  "annotations": {
    "list": [
      {
        "builtIn": 1,
        "datasource": {
          "type": "grafana",
          "uid": "-- Grafana --"
        },
        "enable": true,
        "hide": true,
        "iconColor": "rgba(0, 211, 255, 1)",
        "name": "Annotations & Alerts",
        "type": "dashboard"
      }
    ]
  },
  "editable": true,
  "fiscalYearStartMonth": 0,
  "graphTooltip": 0,
  "id": 8,
  "links": [],
  "panels": [
    {
      "datasource": {
        "default": false,
        "type": "loki",
        "uid": "fdzus37vrepkwb"
      },
      "description": "",
      "gridPos": {
        "h": 7,
        "w": 12,
        "x": 0,
        "y": 0
      },
      "id": 98,
      "options": {
        "dedupStrategy": "none",
        "enableLogDetails": true,
        "prettifyLogMessage": true,
        "showCommonLabels": false,
        "showLabels": false,
        "showTime": false,
        "sortOrder": "Descending",
        "wrapLogMessage": false
      },
      "pluginVersion": "11.2.0",
      "targets": [
        {
          "datasource": {
            "type": "loki",
            "uid": "fdzus37vrepkwb"
          },
          "editorMode": "builder",
          "expr": "{filename=\"/var/log/spring.log\"} |= `INFO`",
          "hide": false,
          "queryType": "range",
          "refId": "A"
        }
      ],
      "title": "INFOS",
      "type": "logs"
    }
  ],
  "schemaVersion": 39,
  "tags": [],
  "templating": {
    "list": []
  },
  "time": {
    "from": "now-6h",
    "to": "now"
  },
  "timepicker": {},
  "timezone": "browser",
  "title": "Info Logs Springboot Test Dashboard",
  "uid": "fe0ggsmsm2igwd",
  "version": 3,
  "weekStart": ""
}
And there we go! The configuration is finally done. You can now enjoy and visualize the logs and metrics data of your Spring Boot application in Grafana. The possibility to have it all in one place makes it much easier to track the performance of your application and to react quickly to potential issues.
Grafana is a powerful tool that displays the collected data in an efficient way. You can create interactive dashboards that show the state of your application at a glance. Whether you're monitoring performance or analyzing errors, the combination of Prometheus, Grafana and Spring Boot gives you the control you need.
Have fun experimenting with the metrics and logs!